Isinglandr:
Landscape Construction and Simulation for Ising Networks

Isinglandr:
Landscape Construction and Simulation for Ising Networks

A toolbox for constructing potential landscapes for Ising networks.
The parameters of the networks can be directly supplied by users or
estimated by the IsingFit package by van Borkulo and
Epskamp (2016) https://CRAN.R-project.org/package=IsingFit from
empirical data. The Ising model’s Boltzmann distribution is preserved
for the potential landscape function. The landscape functions can be
used for quantifying and visualizing the stability of network states, as
well as visualizing the simulation process.
You can install the development version of Isinglandr from GitHub with:
# install.packages("devtools")
devtools::install_github("Sciurus365/Isinglandr")library(Isinglandr)
#> Registered S3 method overwritten by 'Isinglandr':
#> method from
#> print.landscape simlandr
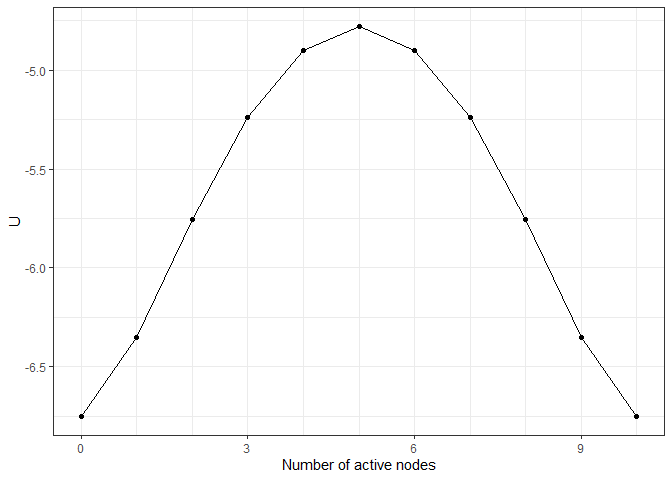
# A toy network and its landscape
Nvar <- 10
m <- rep(0, Nvar)
w <- matrix(0.1, Nvar, Nvar)
diag(w) <- 0
result1 <- make_2d_Isingland(m, w)
plot(result1)
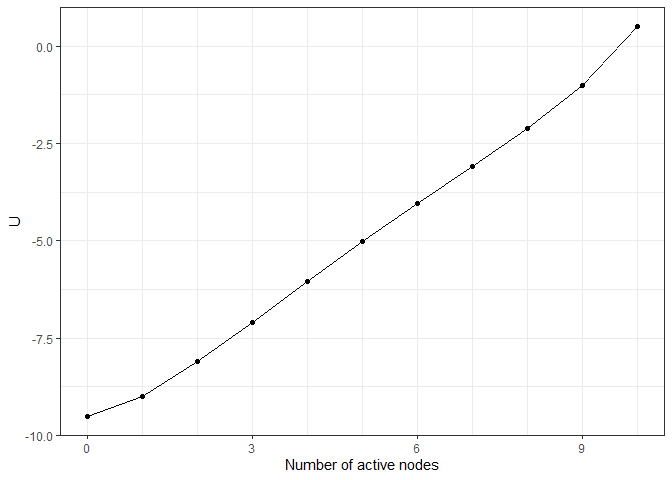
## What if the network becomes denser?
result2 <- make_2d_Isingland(m, 1.5 * w)
plot(result2)
## What if the thresholds become lower?
result3 <- make_2d_Isingland(m - 0.5, w)
plot(result3)
## Multiple networks together
result4 <- make_Ising_grid(
  all_thresholds(seq(-0.1, 0.1, 0.1), .f = `+`),
  whole_weiadj(seq(0.5, 1.5, 0.5)),
  m, w
) %>% make_2d_Isingland_matrix()
plot(result4)
#> Scale for x is already present.
#> Adding another scale for x, which will replace the existing scale.
set.seed(1614)
sim1 <- simulate_Isingland(result1, initial = 5)
plot(sim1)
set.seed(1614)
sim4 <- simulate_Isingland(result4, initial = 5)
plot(sim4)
A shiny app is included in this package to show the landscape for the
Ising network of major depressive disorder. The network parameters can
be manipulated to see how they influence the landscape and the
simulation. Run shiny_Isingland_MDD() to start it.