Acquire and Explore BEC-SMOS L4 Soil Moisture Data in R
The goal of smosr is to automate accessing, downloading
and exploring Soil Moisture and Ocean Salinity (SMOS) Level 4 (L4) data
developed by Barcelona Expert Center (BEC). Particularly, it includes
functions to search for, acquire, extract, and plot BEC-SMOS L4 soil
moisture data downscaled to ~1 km spatial resolution.
Install the released version of smosr from CRAN:
install.packages("smosr")To get a bug fix or to use the newest features of the package,
install the development version of smosr from GitHub:
# install.packages("devtools")
devtools::install_github("tshestakova/smosr")library(smosr)
# # to set credentials for accessing the BEC server
# # note that "username" and "password" should be replaced with your login details
# set_credentials("username", "password")
# to search for BEC-SMOS data with the specified parameters available on the server
start_date <- as.Date("2010-07-15")
end_date <- as.Date("2022-07-15")
date_range <- seq(start_date, end_date, by = 365)
smos_data <- find_smos(freq = 3, orbit = "des", dates = date_range)
#> Done. All requested files were successfully found.
# to download the data from the server to a temporary directory in a local computer
download_smos(data = smos_data)
#> |================================================================================| 100%
# to list all BEC-SMOS data files currently stored in the temporary directory
smos_files <- list_smos()
head(smos_files, 5)
#> [1] "C:/Users/.../Temp/RtmpInOFOr/BEC_SM____SMOS__EUM_L4__D_20100715T183618_001km_3d_REP_v6.0.nc"
#> [2] "C:/Users/.../Temp/RtmpInOFOr/BEC_SM____SMOS__EUM_L4__D_20110715T182802_001km_3d_REP_v6.0.nc"
#> [3] "C:/Users/.../Temp/RtmpInOFOr/BEC_SM____SMOS__EUM_L4__D_20120714T182030_001km_3d_REP_v6.0.nc"
#> [4] "C:/Users/.../Temp/RtmpInOFOr/BEC_SM____SMOS__EUM_L4__D_20130714T181231_001km_3d_REP_v6.0.nc"
#> [5] "C:/Users/.../Temp/RtmpInOFOr/BEC_SM____SMOS__EUM_L4__D_20140714T180441_001km_3d_REP_v6.0.nc"
# to extract soil moisture estimates for the specified geographical locations
# from the list of data files obtained in the previous steps
lat <- c(38.72, 41.90, 48.86, 52.50, 59.44)
lon <- c(-9.14, 12.50, 2.35, 13.40, 24.75)
sm_estimates <- extract_smos(data = smos_files, lat = lat, lon = lon)
#> |================================================================================| 100%
head(sm_estimates, 12)
#> Lat Lon Freq Orbit Date Time SM QA
#> [1,] "38.72" "-9.14" "3d" "D" "2010-07-15" "20:36:18" "0.0176999995528604" "5"
#> [2,] "41.9" "12.5" "3d" "D" "2010-07-15" "20:36:18" "0.0872999977946165" "7"
#> [3,] "48.86" "2.35" "3d" "D" "2010-07-15" "20:36:18" "0.206299994788424" "2"
#> [4,] "52.5" "13.4" "3d" "D" "2010-07-15" "20:36:18" "0.191299995167356" "6"
#> [5,] "59.44" "24.75" "3d" "D" "2010-07-15" "20:36:18" "0.165999995806487" "7"
#> [6,] "38.72" "-9.14" "3d" "D" "2011-07-15" "20:28:02" "0.071999998181127" "3"
#> [7,] "41.9" "12.5" "3d" "D" "2011-07-15" "20:28:02" "0.025399999358342" "7"
#> [8,] "48.86" "2.35" "3d" "D" "2011-07-15" "20:28:02" "0.0235999994038139" "6"
#> [9,] "52.5" "13.4" "3d" "D" "2011-07-15" "20:28:02" "0.0769999980548164" "2"
#> [10,] "59.44" "24.75" "3d" "D" "2011-07-15" "20:28:02" "0.144699996344571" "7"
#> [11,] "38.72" "-9.14" "3d" "D" "2012-07-14" "20:20:31" "0.0246999993760255" "5"
#> [12,] "41.9" "12.5" "3d" "D" "2012-07-14" "20:20:31" "0.000499999987368938" "7"
# to plot extracted temporal series of soil moisture data
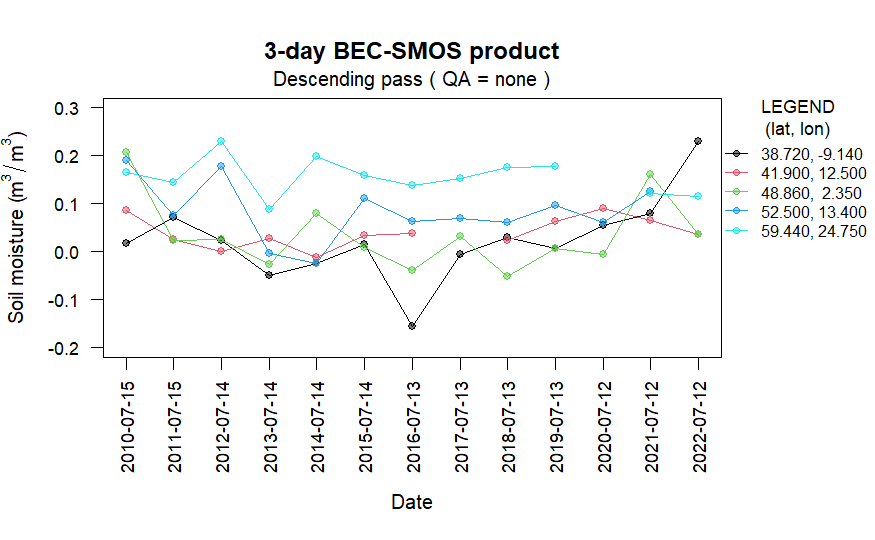
plot_temporal_smos(data = sm_estimates)
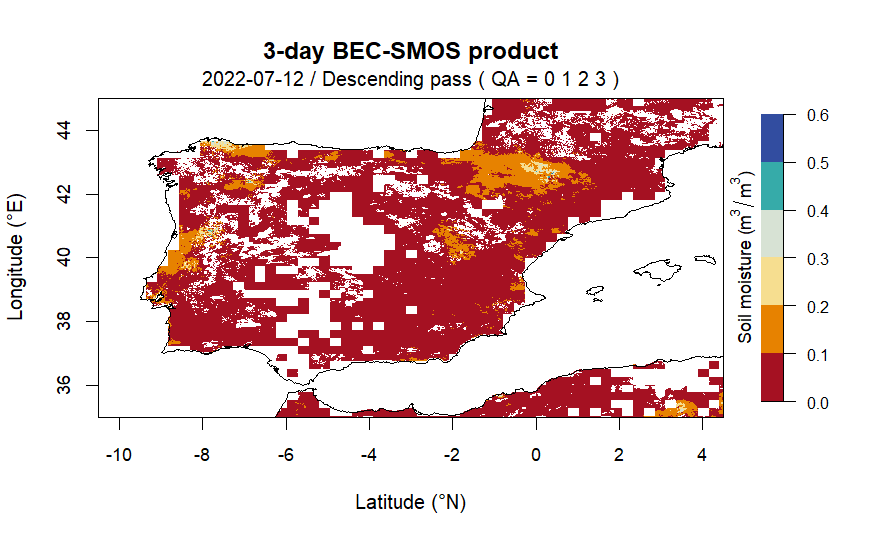
# to draw a raster image of soil moisture estimates from a file with
# desired data quality and within the specified geographical bounds
lat <- c(35.00, 45.00)
lon <- c(-10.50, 4.50)
plot_raster_smos(data = smos_files[13], lat = lat, lon = lon, QA = c(0,1,2,3))
If you encounter a clear bug, please file an issue with a minimal reproducible example on GitHub.
For questions and other discussion, please use Stack Overflow and the RStudio community.