autodb is an R package for automatic normalisation of a data frame to third normal form, with the intention of easing the process of data cleaning. (Usage to design your actual database for you is not advised.)
You can install the development version of autodb from GitHub with:
# install.packages("devtools")
devtools::install_github("CharnelMouse/autodb")Turning a simple data frame into a database:
library(autodb)
#>
#> Attaching package: 'autodb'
#> The following object is masked from 'package:stats':
#>
#> decomposesummary(ChickWeight)
#> weight Time Chick Diet
#> Min. : 35.0 Min. : 0.00 13 : 12 1:220
#> 1st Qu.: 63.0 1st Qu.: 4.00 9 : 12 2:120
#> Median :103.0 Median :10.00 20 : 12 3:120
#> Mean :121.8 Mean :10.72 10 : 12 4:118
#> 3rd Qu.:163.8 3rd Qu.:16.00 17 : 12
#> Max. :373.0 Max. :21.00 19 : 12
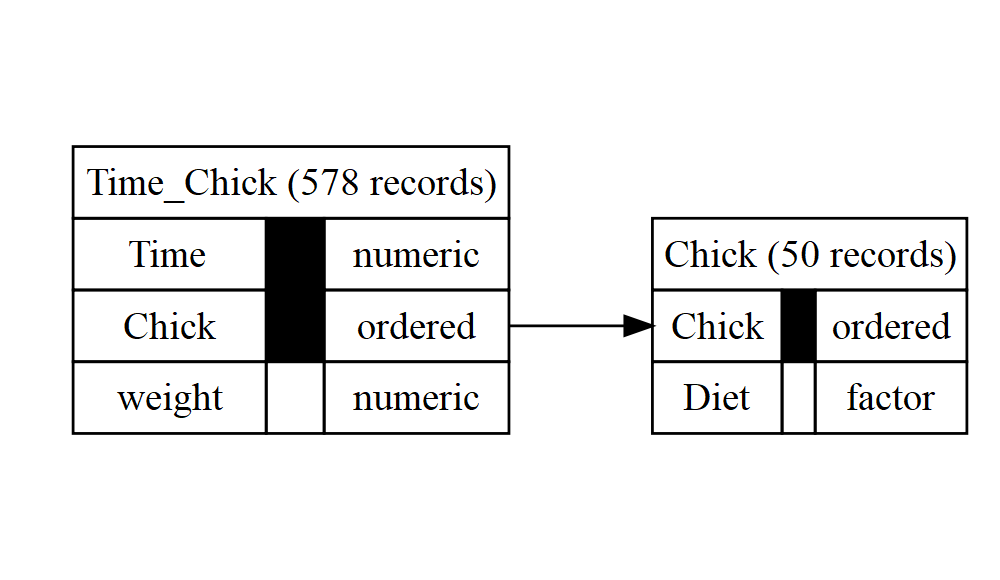
#> (Other):506db <- autodb(ChickWeight, name = "ChickWeight")
db
#> database ChickWeight with 2 relations
#> 4 attributes: weight, Time, Chick, Diet
#> relation Chick: Chick, Diet; 50 records
#> key 1: Chick
#> relation Time_Chick: Time, Chick, weight; 578 records
#> key 1: Time, Chick
#> references:
#> Time_Chick.{Chick} -> Chick.{Chick}graphviz_text <- gv(db)
DiagrammeR::grViz(graphviz_text)
Using the exclude argument to forbid certain variables
from appearing in keys:
summary(CO2)
#>      Plant             Type         Treatment       conc          uptake
#>  Qn1    : 7   Quebec     :42   nonchilled:42   Min.   :  95   Min.   : 7.70
#>  Qn2    : 7   Mississippi:42   chilled   :42   1st Qu.: 175   1st Qu.:17.90
#>  Qn3    : 7                                    Median : 350   Median :28.30
#>  Qc1    : 7                                    Mean   : 435   Mean   :27.21
#>  Qc3    : 7                                    3rd Qu.: 675   3rd Qu.:37.12
#>  Qc2    : 7                                    Max.   :1000   Max.   :45.50
#>  (Other):42
db2_noexclude <- autodb(CO2, name = "CO2")
db2_noexclude
#> database CO2 with 3 relations
#> 5 attributes: Plant, Type, Treatment, conc, uptake
#> relation Plant: Plant, Type, Treatment; 12 records
#> key 1: Plant
#> relation Plant_conc: Plant, conc, Treatment, uptake; 84 records
#> key 1: Plant, conc
#> key 2: Treatment, conc, uptake
#> relation conc_uptake: conc, uptake, Type; 82 records
#> key 1: conc, uptake
#> references:
#> Plant_conc.{Plant} -> Plant.{Plant}
#> Plant_conc.{conc, uptake} -> conc_uptake.{conc, uptake}graphviz_text2_noexclude <- gv(db2_noexclude)
DiagrammeR::grViz(graphviz_text2_noexclude)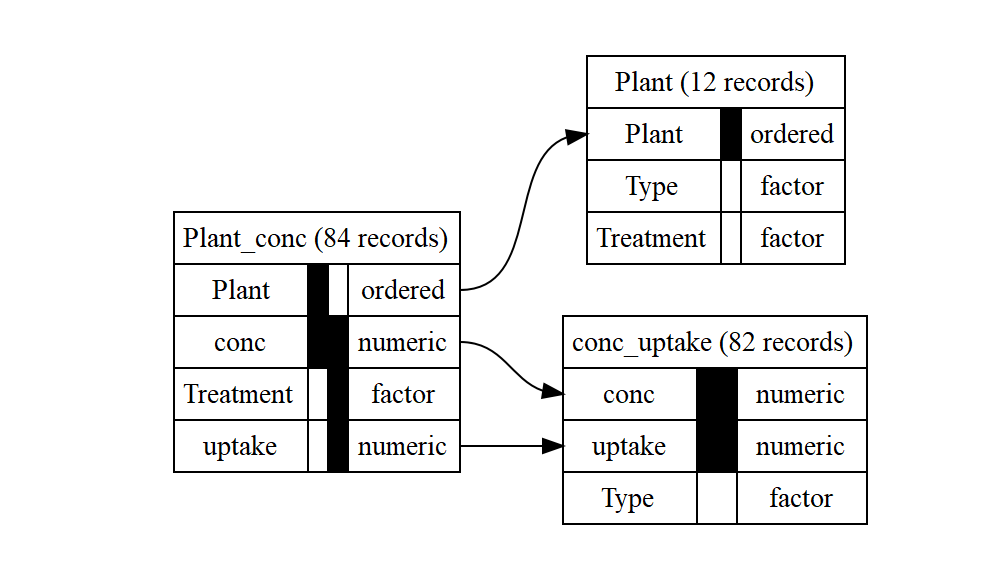
db2 <- autodb(CO2, name = "CO2", exclude = "uptake")
db2
#> database CO2 with 2 relations
#> 5 attributes: Plant, Type, Treatment, conc, uptake
#> relation Plant: Plant, Type, Treatment; 12 records
#>   key 1: Plant
#> relation Plant_conc: Plant, conc, uptake; 84 records
#>   key 1: Plant, conc
#> references:
#> Plant_conc.{Plant} -> Plant.{Plant}
graphviz_text2 <- gv(db2)
DiagrammeR::grViz(graphviz_text2)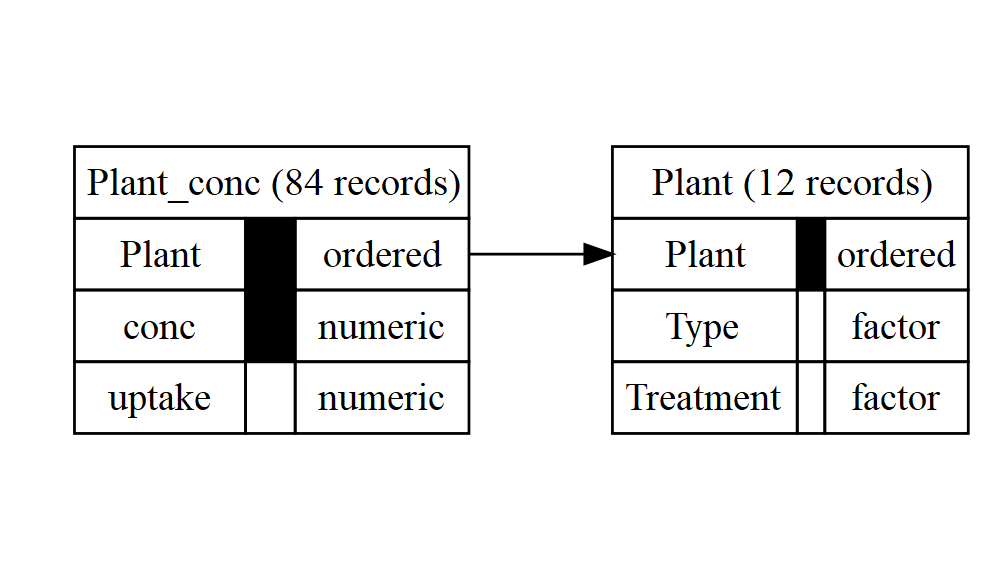
There are also functions for doing each step of the database creation separately, including functional dependency detection and normalisation. See the vignette for more details.