teal:
Interactive Exploratory Data Analysis with Shiny
Web-Applications
teal:
Interactive Exploratory Data Analysis with Shiny
Web-Applications
![]()
![]()
![]()


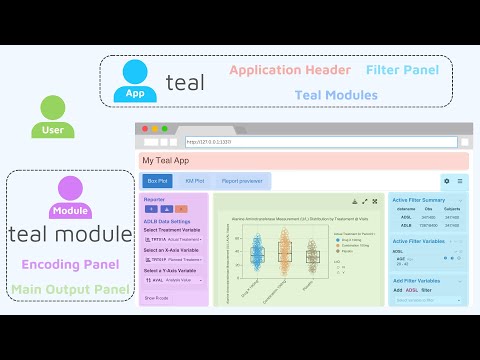
teal is a shiny-based interactive
exploration framework for analyzing data. teal applications
require app developers to specify:
data.framedata.frames with
key columns to enable data joinsMultiAssayExperiment objects which are R
data structures for representing and analyzing multi-omics
experimentsteal modules:
teal modules are shiny modules built
within the teal framework that specify analysis to be
performed. For example, it can be a module for exploring outliers in the
data, or a module for visualizing the data in line plots. Although these
can be created from scratch, many teal modules have been
released and we recommend starting with modules found in the following
packages:
teal.modules.general:
general modules for exploring relational/independent/CDISC datateal.modules.clinical:
modules specific to CDISC data and clinical trial reportingteal.modules.hermes:
modules for analyzing MultiAssayExperiment objectsA lot of the functionality of the teal framework derives
from the following packages:
teal.data:
creating and loading the data needed for teal
applications.teal.widgets:
shiny components used within teal.teal.slice:
provides a filtering panel to allow filtering of data.teal.code:
handles reproducibility of outputs.teal.logger:
standardizes logging within teal framework.teal.reporter:
allows teal applications to generate reports.Dive deeper into teal with our comprehensive video
guide. Please click the image below to start learning:
install.packages("teal")Alternatively, you might also use the development version.
# install.packages("pak")
pak::pak("insightsengineering/teal")library(teal)
app <- init(
data = teal_data(iris = iris),
modules = list(
module(
label = "iris histogram",
server = function(input, output, session, data) {
updateSelectInput(session = session,
inputId = "var",
choices = names(data()[["iris"]])[1:4])
output$hist <- renderPlot({
req(input$var)
hist(x = data()[["iris"]][[input$var]])
})
},
ui = function(id) {
ns <- NS(id)
list(
selectInput(inputId = ns("var"),
label = "Column name",
choices = NULL),
plotOutput(outputId = ns("hist"))
)
}
)
)
)
shinyApp(app$ui, app$server)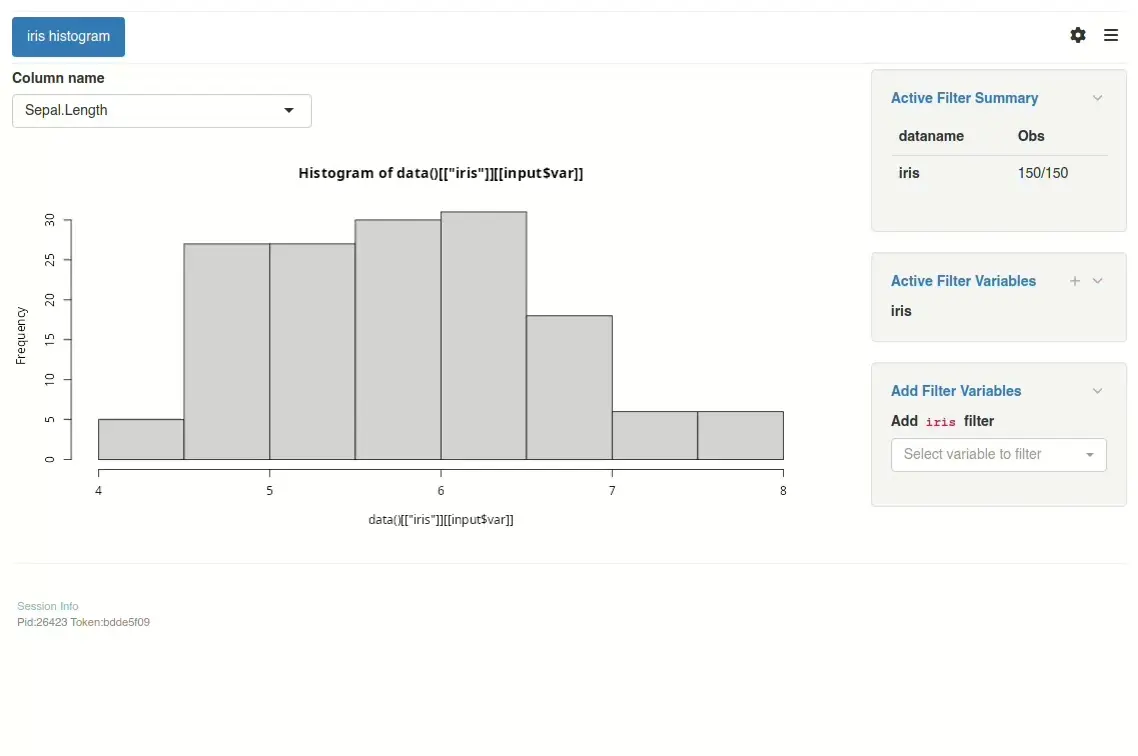
Please see teal.gallery
and TLG
Catalog to see examples of teal apps.
Please start with the “Technical Blueprint” article, “Getting Started” article, and then other package vignettes for more detailed guide.
If you encounter a bug or have a feature request, please file an
issue. For questions, discussions, and updates, use the
teal channel in the pharmaverse slack
workspace.
This package is a result of a joint efforts by many developers and stakeholders. We would like to thank everyone who contributed so far!

